Strategic Infographic
スライド・動画・インフォグラフィック使う場所: スライド / インフォグラフィック
A professional, data-centric layout focused on a "Problem-Solution- Impact" narrative. It utilizes clean vector iconography, prominent "Hero Statistics" to establish high-stakes economic or technical value, and side-by-side comparison tables to validate a specific mandate or policy. Best for policy mandates, business cases, economic impact summaries, and environmental/sustainability transitions.
投稿者 Mark Carver — Visual Style Guide for NotebookLM Presentations — 敬意を込めて。
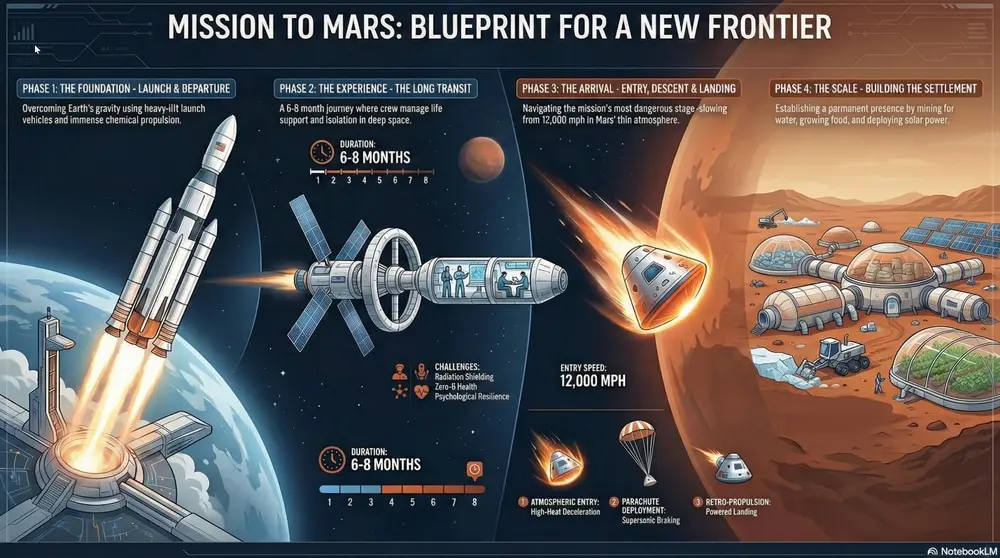
A professional Strategic Infographic style with a clean, vector-based layout. Use a logical narrative flow featuring high-impact numerical callouts for 'Hero Statistics,' bold headers for problem/solution framing, and technical comparison tables. The aesthetic should be modern and authoritative, utilizing a limited professional color palette and flat-design iconography.
使い方
- 1Studio パネルでスライドまたはインフォグラフィックを選び、そのプロンプト欄を開きます。
- 2スタイルの指定を貼り付けます。
- 3生成し、出力がずれていたら文言を調整します。
角括弧の部分は、ご自身のトピックや質問に置き換えてください。
スライド・動画・インフォグラフィックの他のプロンプト
- ChalkboardWhite "chalk" lines on a dark slate background with textured shading. Best for academic lectures, physics/math proofs, and historical retrospectives.
- WhiteboardA clean look resembling markers on a glossy whiteboard. Best for internal team briefings, "live" brainstorming sessions, and agile project updates.
- Sketch NotingHand-drawn icons and connectors with a classic "visual note-taking" feel. Best for executive summaries, workshop synthesis, and human-centric storytelling.
- Graphite & Charcoal RealismA fine-art style using monochromatic hand-drawn textures, cross- hatching, and realistic smudging. Best for high-stakes ethical discussions, historical reflections, or "Day in the Life" human-centric storytelling.